
In Understanding the Ear’s Sensitivity and Loudness Perception, you learn that humans don’t hear all sounds the same way — we are more sensitive to certain frequencies than others.
(If you want to better understand the concept of frequencies, read this article).
So, when we measure sound, we need to account for how we actually hear it, not just what the microphone picks up.
This is done by applying what’s called a weighting to the sound signal.
The equal-loudness curves (also Fletcher-Munson curves) introduced previously are the foundation for this process. They show how loud different frequencies need to be for us to perceive them as equally loud. Remember, they look like this.
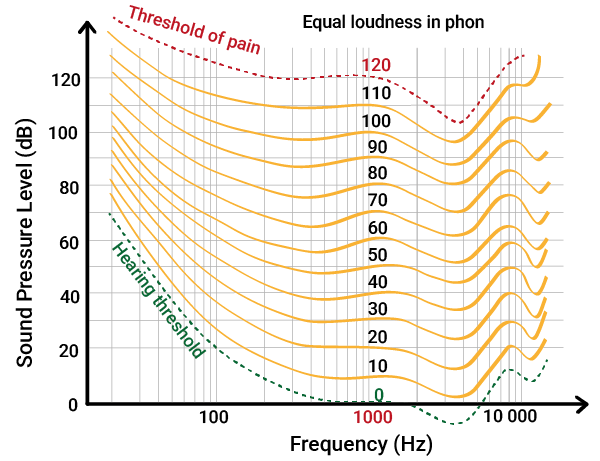
However, these curves are too complex to use directly in sound measuring devices.
But while the original curves were important, modern research has refined them — and today we use updated contours defined in ISO 226:2023 – Normal equal-loudnesslevel contours.
Historically, many sources said that A-weighting was based on the 40-phon curve, suggesting it’s only useful for quiet environments. But this is no longer accurate.
Modern studies (and ISO 226) show that the A-weighting filter actually aligns more closely with the 60-phon curve, making it valid for everyday sound levels, not just low-level noise.
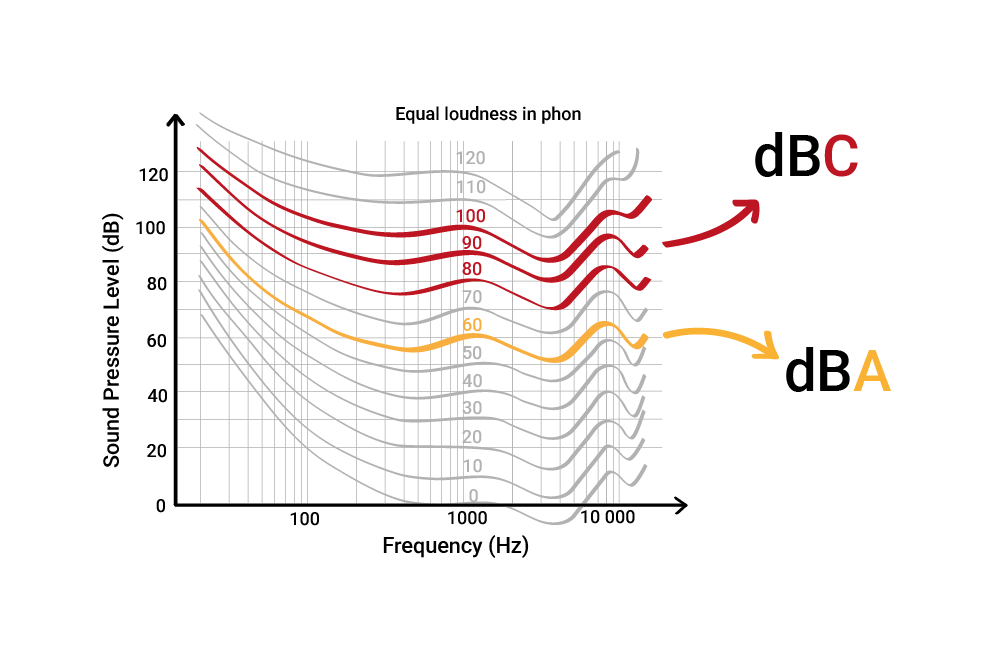
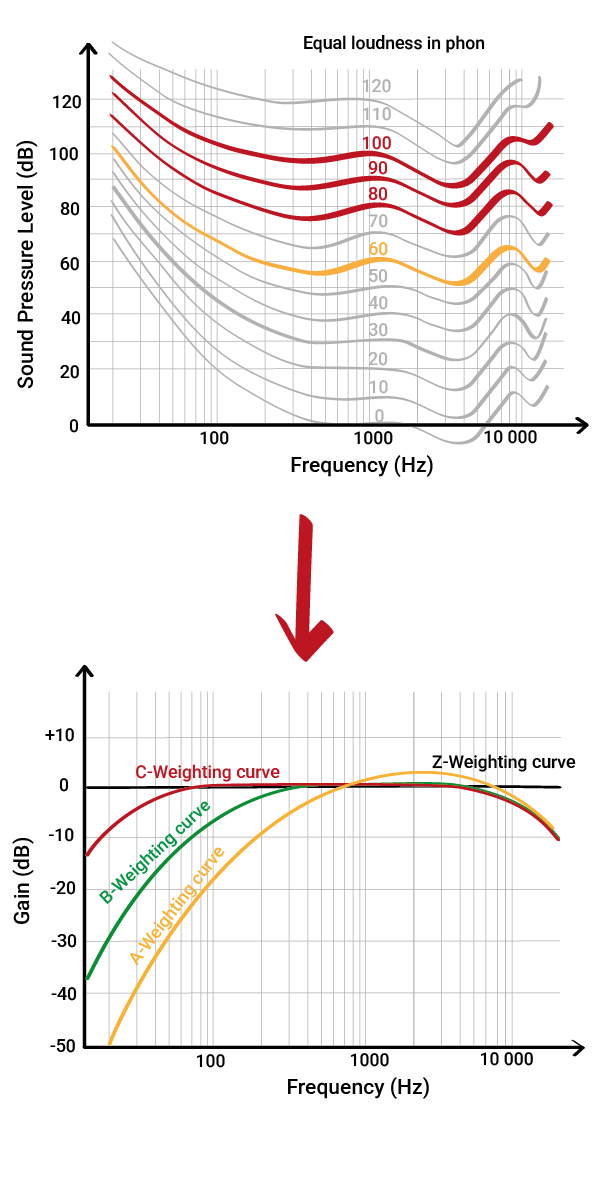
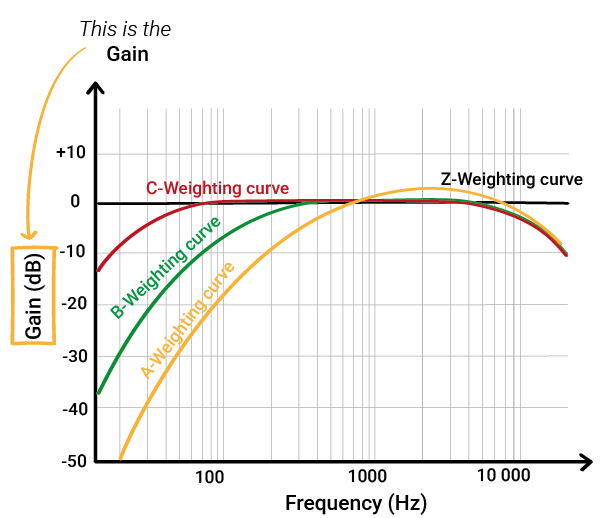
That said, the full equal-loudness curves are still too complex to use directly in hardware. So engineers simplified things by flipping the curves and smoothing them into easier-to-apply filters:
- A-weighting ≈ inverse of the 60-phon curve (normal ‘everyday’ sounds)
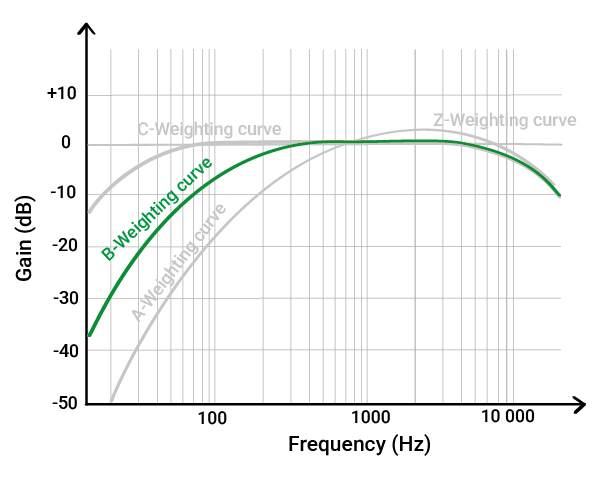
- B-weighting ≈ inverse of the medium-loud (less commonly used today)
- C-weighting ≈ inverse of the 80-phon / 100-phon curve (very loud)
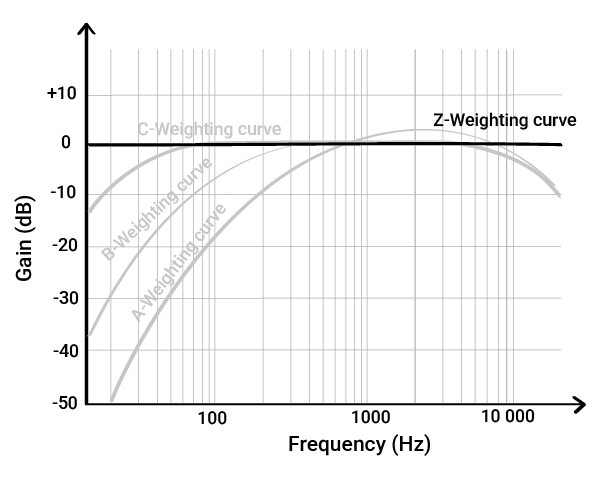
- Z-weighting = A flat, unmodified response – no boost, no reduction (think “Zero”).
(If you want to know where to find the exact values used in each third-octave and octave frequency band, scroll down to the bottom of the post)
A-weighting mainly reduces low frequencies and slightly boosts some mid-high frequencies.
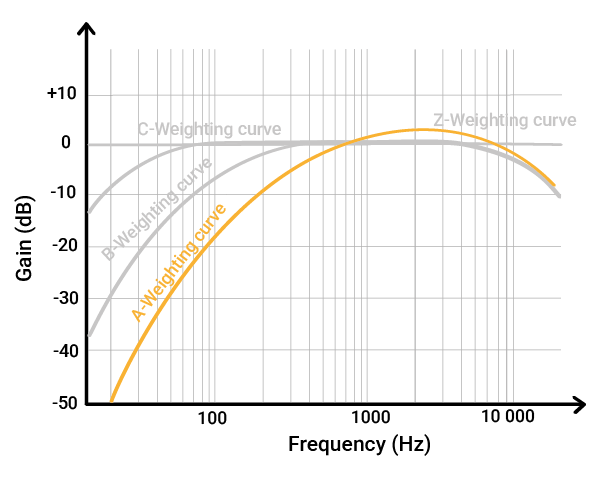
It is designed to match how we perceive sounds at normal levels — usually around 45 to 85 dB.
Today, A-weighting is used almost everywhere:
- in building regulations
- product noise data
- and standards.
If you have ever seen dB(A) on a report or a sound level meter, this is the A-weighting being used.
B-weighting was designed for medium-loud sounds. It cuts the low frequencies less than A-weighting but isn’t widely used anymore.
You might still find it in older research papers or measurement reports, especially from the 1970s and 1980s.
C-weighting provides a nearly flat response across most of the hearing range, especially keeping the low frequencies that A-weighting removes.

Z-weighting is completely flat from 10 Hz to 20 kHz, with no correction applied. It represents the raw, unfiltered signal that the microphone picks up.
Use dB(Z) when you want to see the true frequency content of the sound, without any adjustments.
When you — or a sound level meter — analyse a sound, you can either look at the raw data or apply a specific weighting:
- dB(A)
- dB(B)
- or dB(C)
If you choose a weighting, the device processes each frequency band individually, applying corrections based on the gain of the selected curve.
It adds or subtracts gain values band-by-band, depending on how sensitive the human ear is to each frequency.
“The result is a single, easy-to-understand value that combines all frequency bands. We call this a ‘broadband‘ value, and it gives a better sense of how loud a sound feels to the human ear.”
The letter in brackets — A, B, or C — tells you which weighting curve was used.