Sound absorption classes are often used to specify sound absorption materials to be installed in buildings.
But have you ever wondered what they are exactly, what they represent and how they are established/calculated?
If you want to know, this short article has been created for you, with some graphics to make you understand the calculation process.
Enjoy the read!
(See at the end the references used to confirm the concepts)

Do you want to be notified when new posts are published?
Why don’t you subscribe to Atelier Crescendo’s newsletter by clicking here?
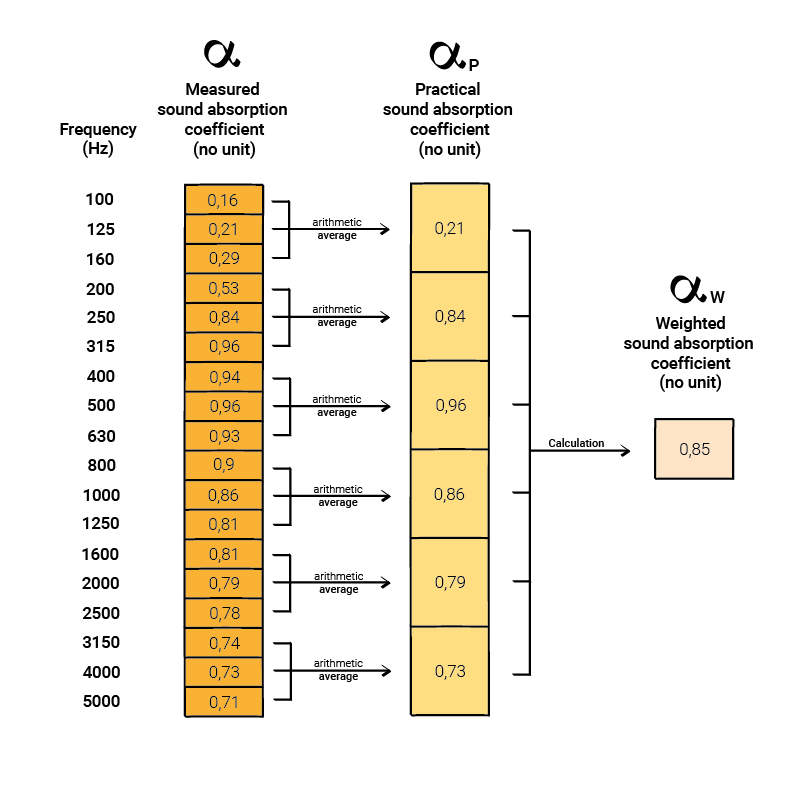
Sound absorption data is typically measured in third-octave bands.
(if you need to understand about frequencies read this article, and frequency bands read this article)
The initial conversion involves transitioning from the sound absorption coefficient measured in third-octave bands to the Practical Sound Absorption Coefficient (αp) in octave bands (as introduced in this article).
From there, we calculate the Weighted Sound Absorption Coefficient (αw), which is a single number determined as detailed below.
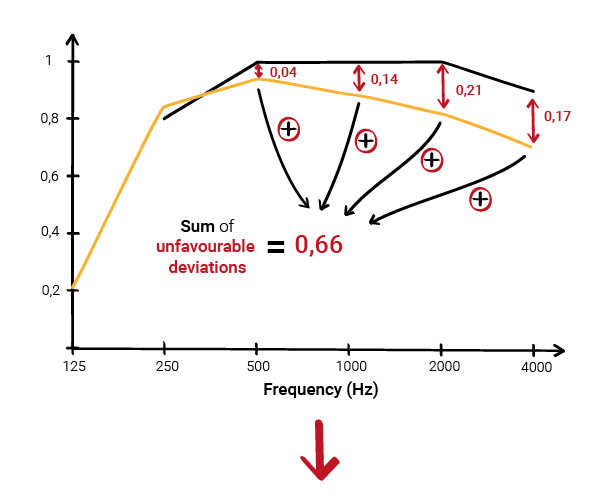
We begin with two curves:
- the Practical Sound Absorption Coefficient (αp) values calculated (in yellow below).
- A curve known as the reference curve, with specific values for each octave band between 250 Hz and 4000 Hz (in black below).
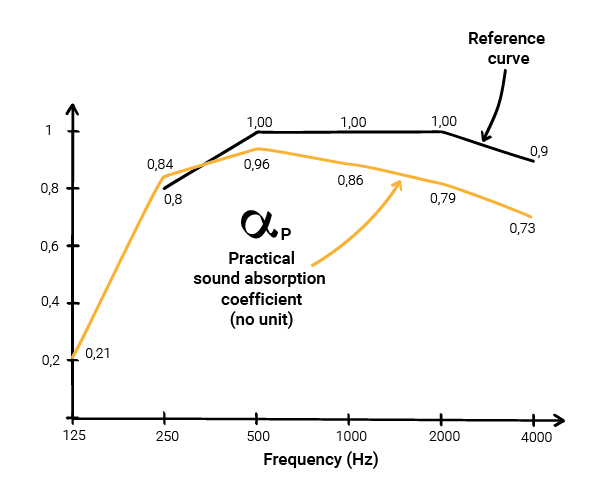
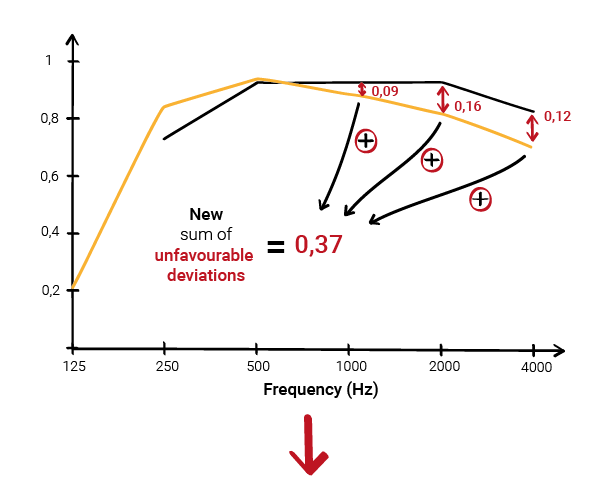
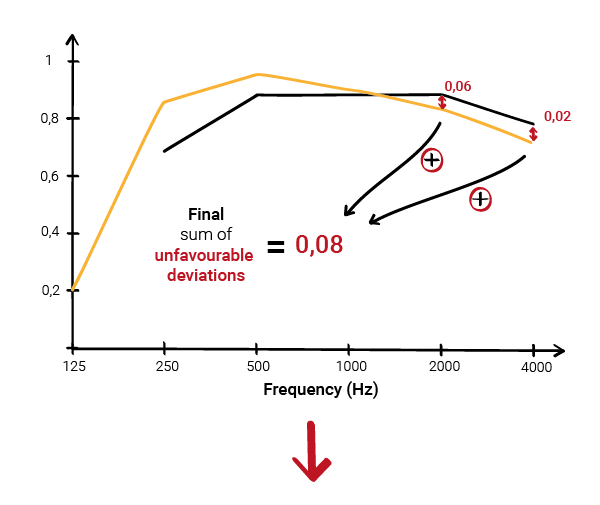
The second step involves calculating the “unfavourable deviations” for each octave band.
Note 1
An unfavorable deviation occurs when, for a given octave, the measured value is
less
than the value of the reference curve.
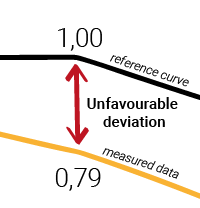
And vice versa, a ‘favourable’ deviation occurs when, for a given octave, the measured value is
more
than the value of the reference curve.
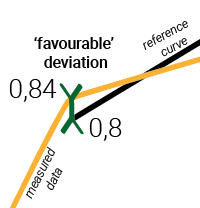
Note 2
In the calculations, we only consider
unfavourable deviations.
Then, we incrementally adjust the reference curve in 0.05 steps toward the measured value until the sum of unfavorable deviations is ≤ 0.10.
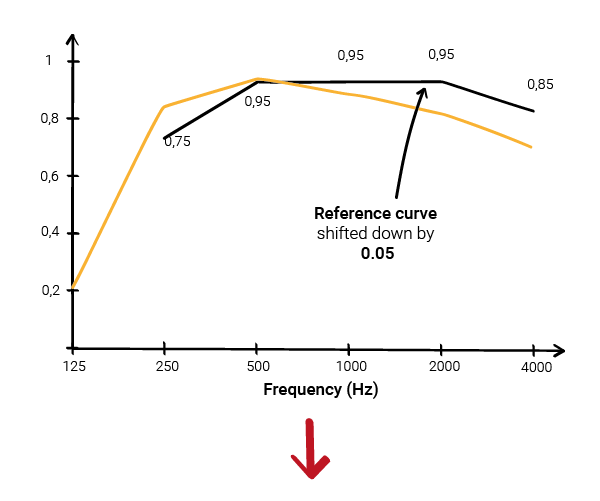

Once this criterion (≤ 0.10) is met, the performance (αw) for the material is determined by the value of the shifted reference curve at 500 Hz.
Another important point to note is if a measured value exceeds the reference value by more than 0.25 (even after the shifting process), a shape indicator is added to the weighted sound absorption performance as follows:
- L, like αw (L), if excess occurs at 250 Hz
- M, like αw (M), if excess occurs at 500 and 1000 Hz
- H, like αw (H), if excess occurs at 2000 and 4000 Hz
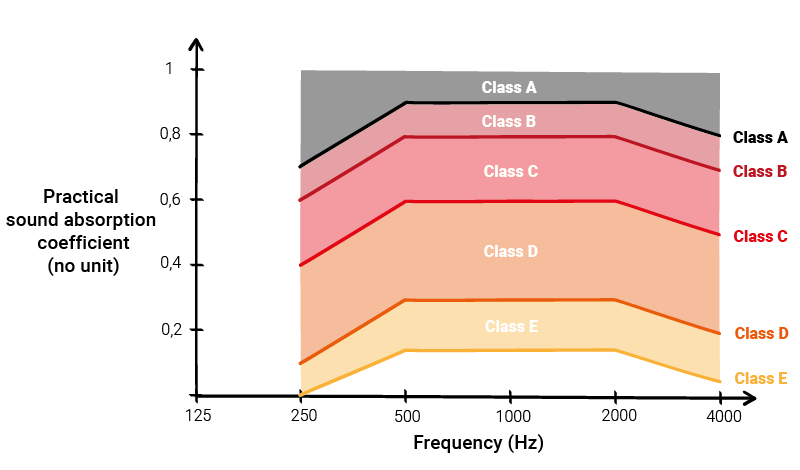
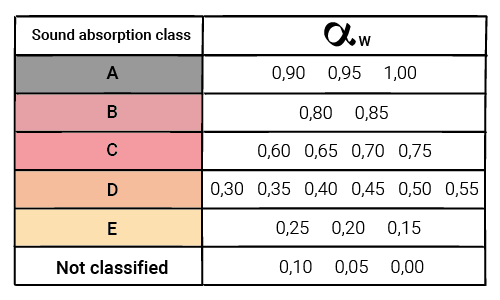
Once the single number is calculated, we associate it with a class using the table below.
The figure below presents the reference curves corresponding to each class (you have probably seen this type of graph before).